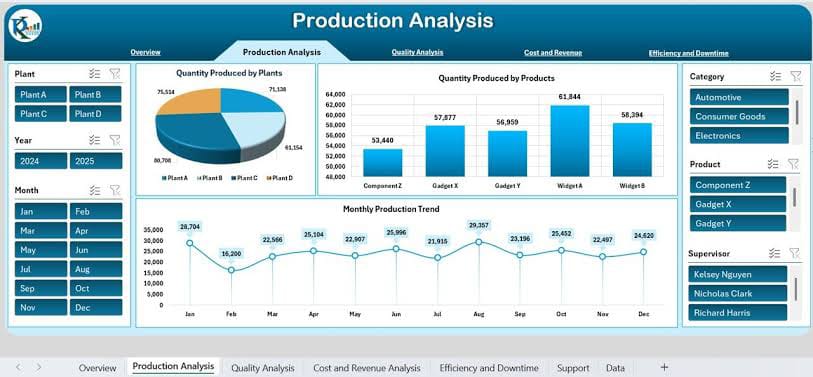
Production Intelligence
Production Analysis
Plant-wise production, product output and monthly production trends.
These dashboard images are used as demonstration examples to show the style and breadth of Power BI reporting.
Plant-wise production, product output and monthly production trends.
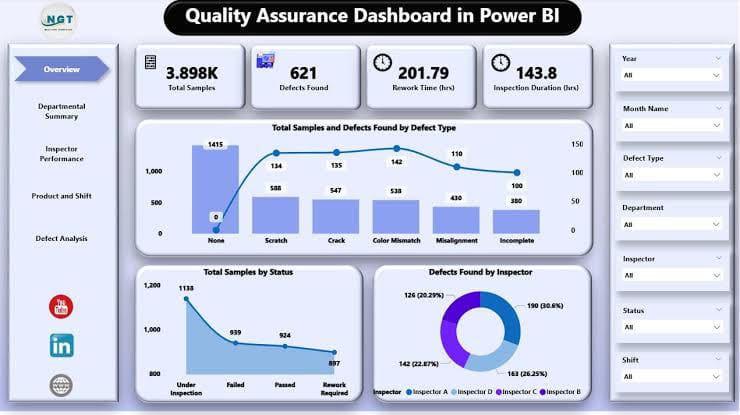
Samples, defects, inspection duration, defect types and inspector performance.
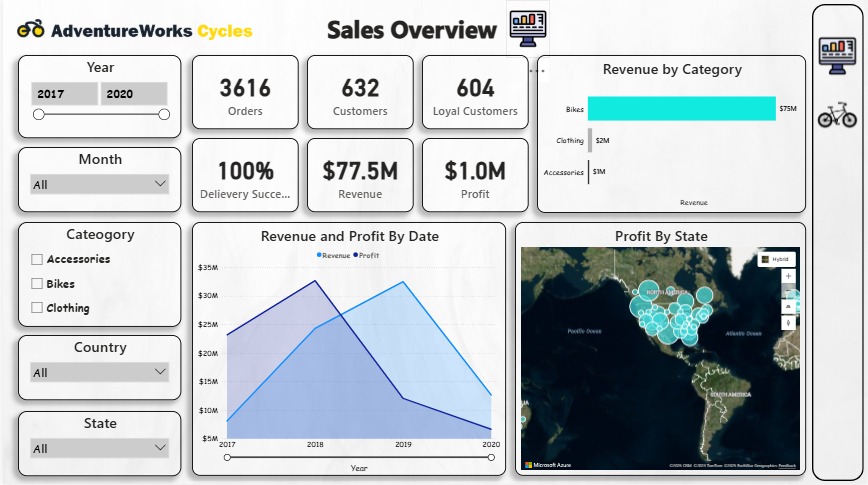
Revenue, orders, customers, profit, categories and geographic analysis.
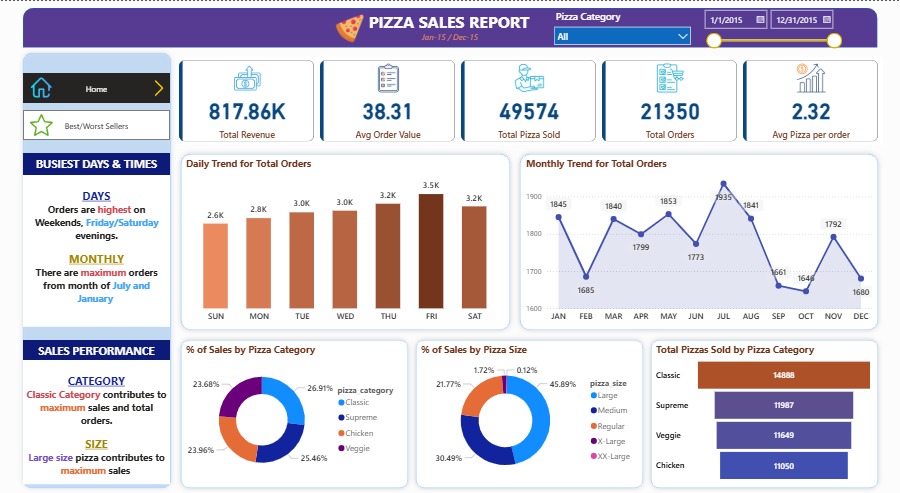
Daily and monthly order trends, category mix and sales performance.
These are demonstration visuals. They are not presented as client projects or results.