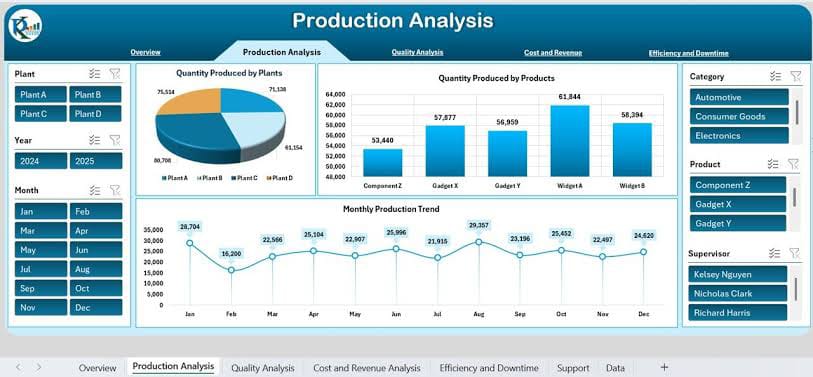
Production
Production Analysis
Plant, product and monthly output analysis.
FactoryIQ helps management teams see what is happening across production, quality, sales, inventory and operations through focused Power BI reporting.
Our focus is not just making charts. We work around the business questions management needs answered.
Track output, production trends, plant comparisons, product performance and targets.
Bring inspection and defect information into a consistent management view.
Understand revenue, orders, customers, products, territories and profitability.
These examples are visual references for the type of Power BI solutions we can tailor to your data and process.
Plant, product and monthly output analysis.
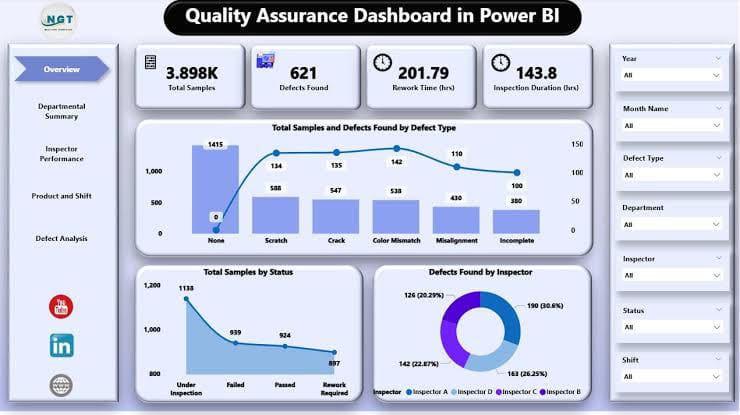
Defects, samples, inspection and quality performance.
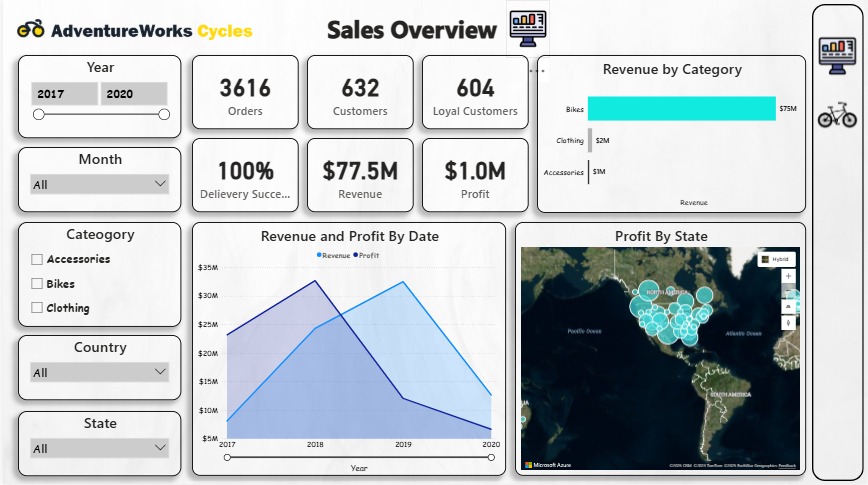
Revenue, orders, customers, profit and geography.
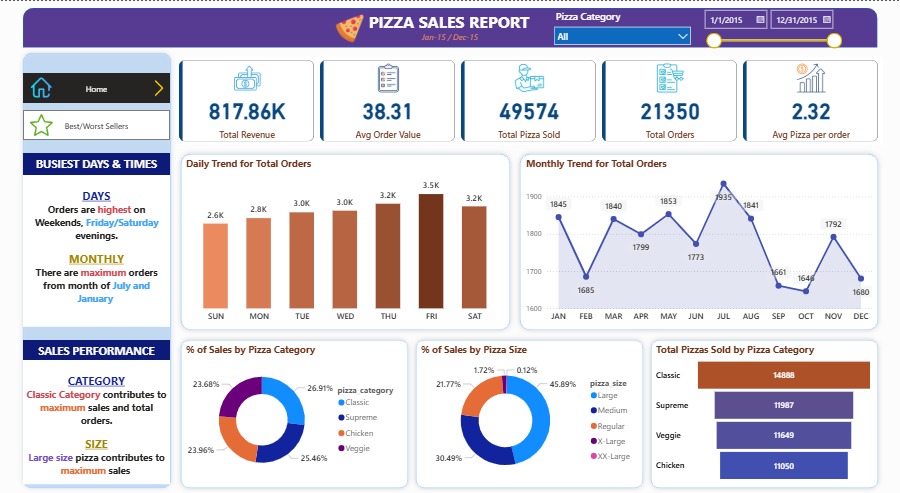
Daily and monthly sales trends and category analysis.
Dashboard images are demonstration examples and should not be represented as client work unless separately authorized.
Discuss your process, reports and management questions.
Review Excel, SQL, ERP exports or other available sources.
Design the Power BI model, measures and management pages.
Refine the solution as your business requirements grow.