Production Intelligence
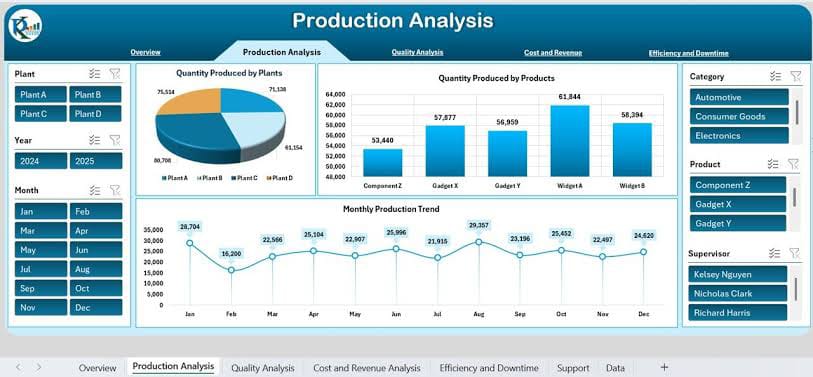
Production Analysis
Plant-wise production, product output and monthly production trends.
Power BI dashboards and business intelligence services designed for manufacturing companies that want clearer visibility into production, quality, sales, inventory and performance.
We combine Power BI, SQL and practical business reporting to turn existing operational data into useful management information.
Output, plant performance, product mix, targets and production trends.
Defects, inspections, rejection trends, quality performance and root-cause views.
Revenue, orders, customers, products, territories and profitability.
Stock position, movement, aging and inventory-related management reporting.
The following are demonstration examples showing the type of visual management reporting we can build. They are not presented as client projects.
Plant-wise production, product output and monthly production trends.
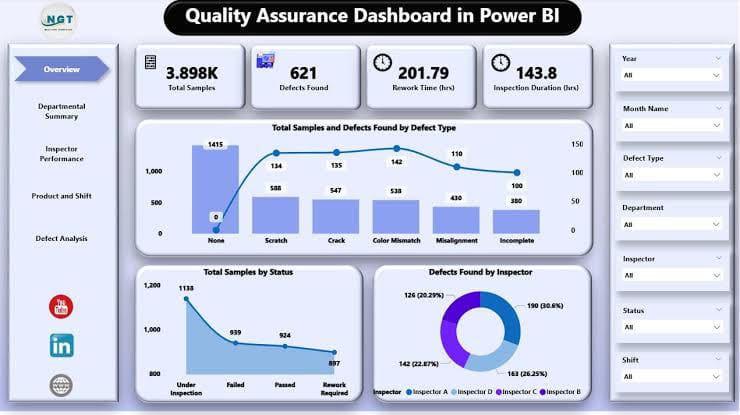
Samples, defects, inspection duration, defect types and inspector performance.
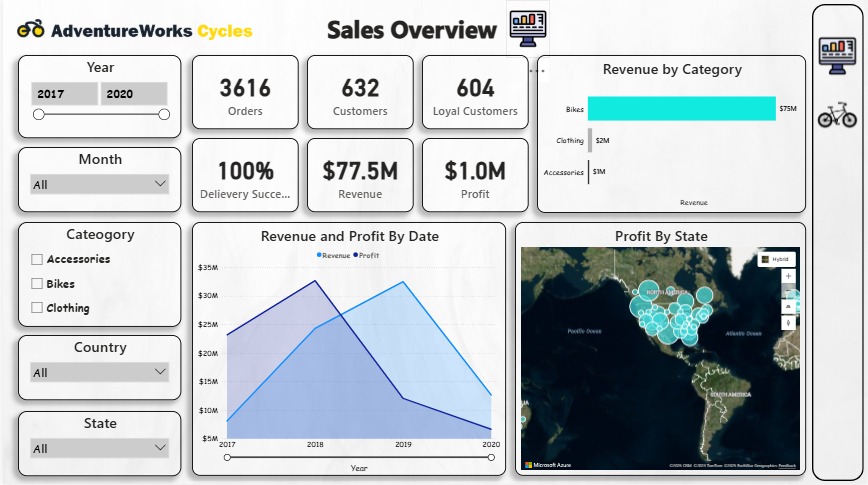
Revenue, orders, customers, profit, categories and geographic analysis.
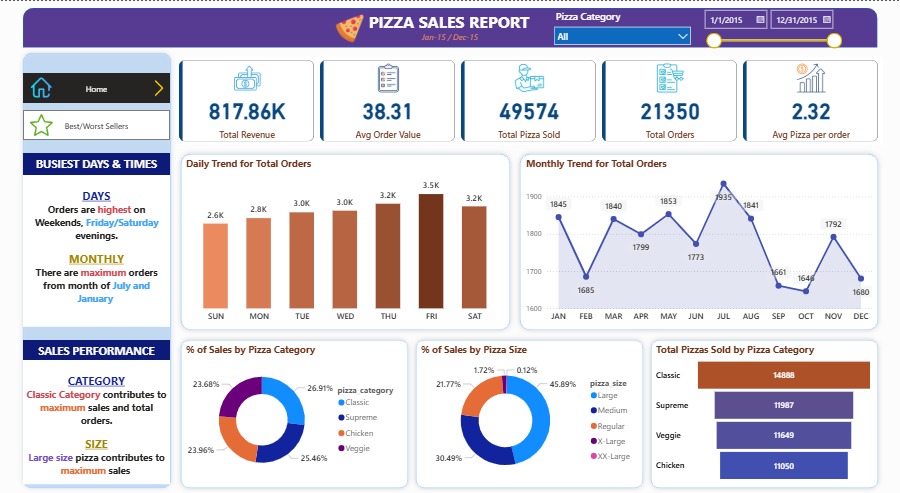
Daily and monthly order trends, category mix and sales performance.
We can begin with one reporting problem and expand the solution as your requirements and confidence grow.
Let's see what can be turned into a management dashboard.